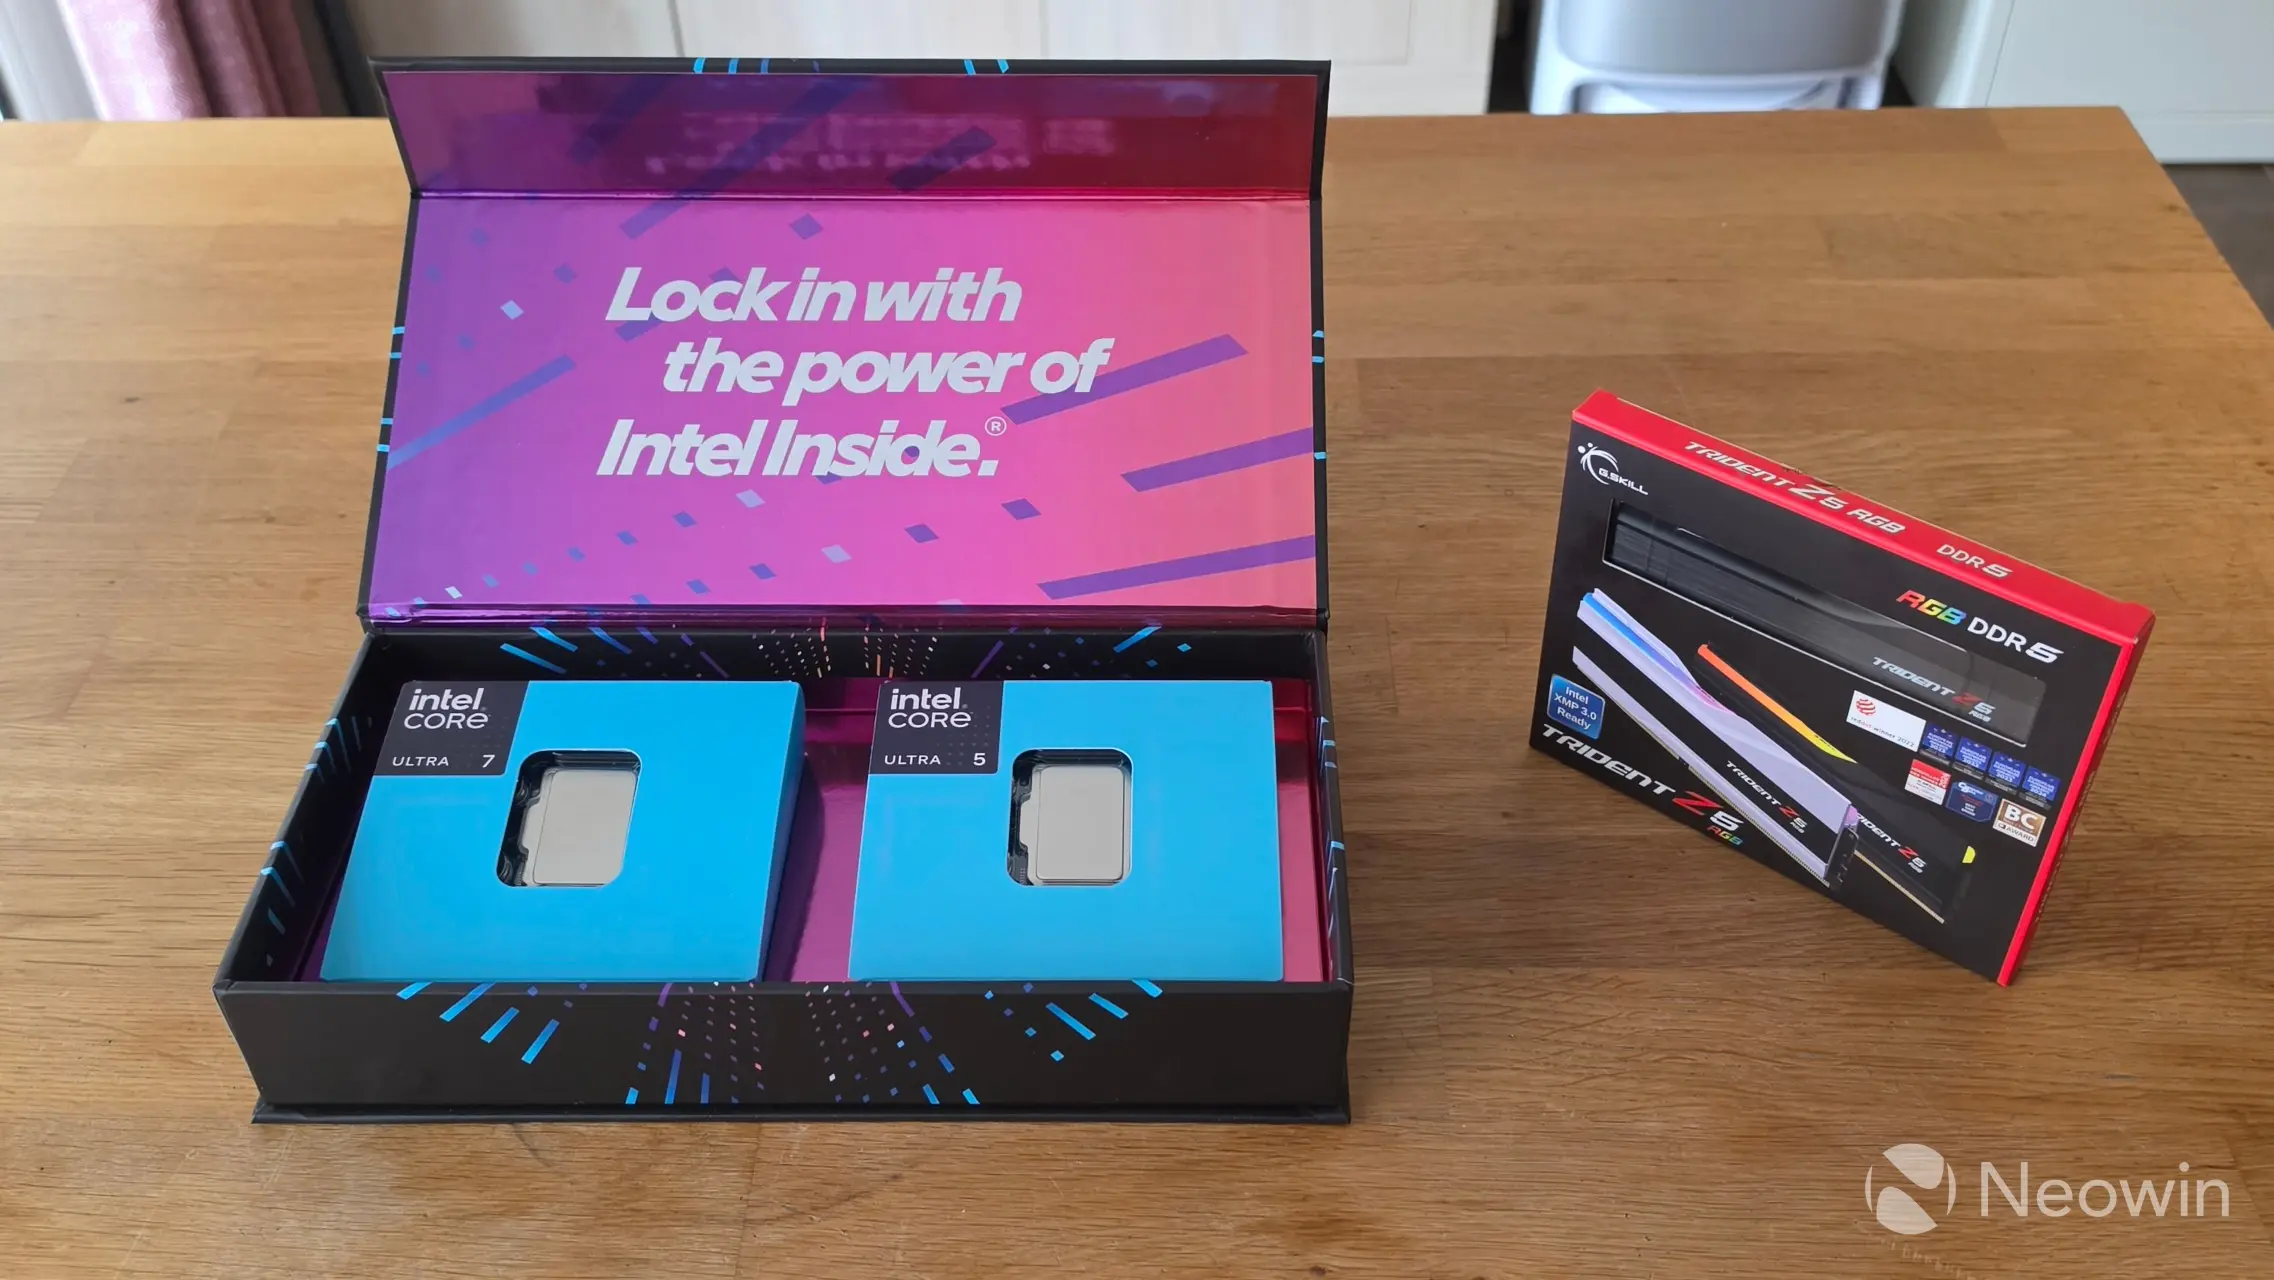
It has been about two and a half years since we last did a review for Intel processors, back then the 14th generation of Core Ultra CPUs were being released and we pitched the i5-14600K and i9-14900K against the AMD Ryzen 9 7950X3D, now today Intel sent us the Intel Core Ultra 5 250K Plus, Intel Core Ultra 7 270K Plus, and 32GB of G.Skill Trident Z5 RGB 7200 MT/s memory to put through its paces; we"ll be pitching them against each other along with the Intel Core Ultra 9 285K, and AMD Ryzen 9 9950X3D (see our review of that here).
With that out of the way, now the disclosures: Intel let me keep the Intel Core Ultra 5 250K Plus, Intel Core Ultra 7 270K Plus, and memory samples they provided, TEAMGROUP provided an MP44Q 4TB, and T-Force Z540 2TB NVMe for us to use in our test builds.
Introduction
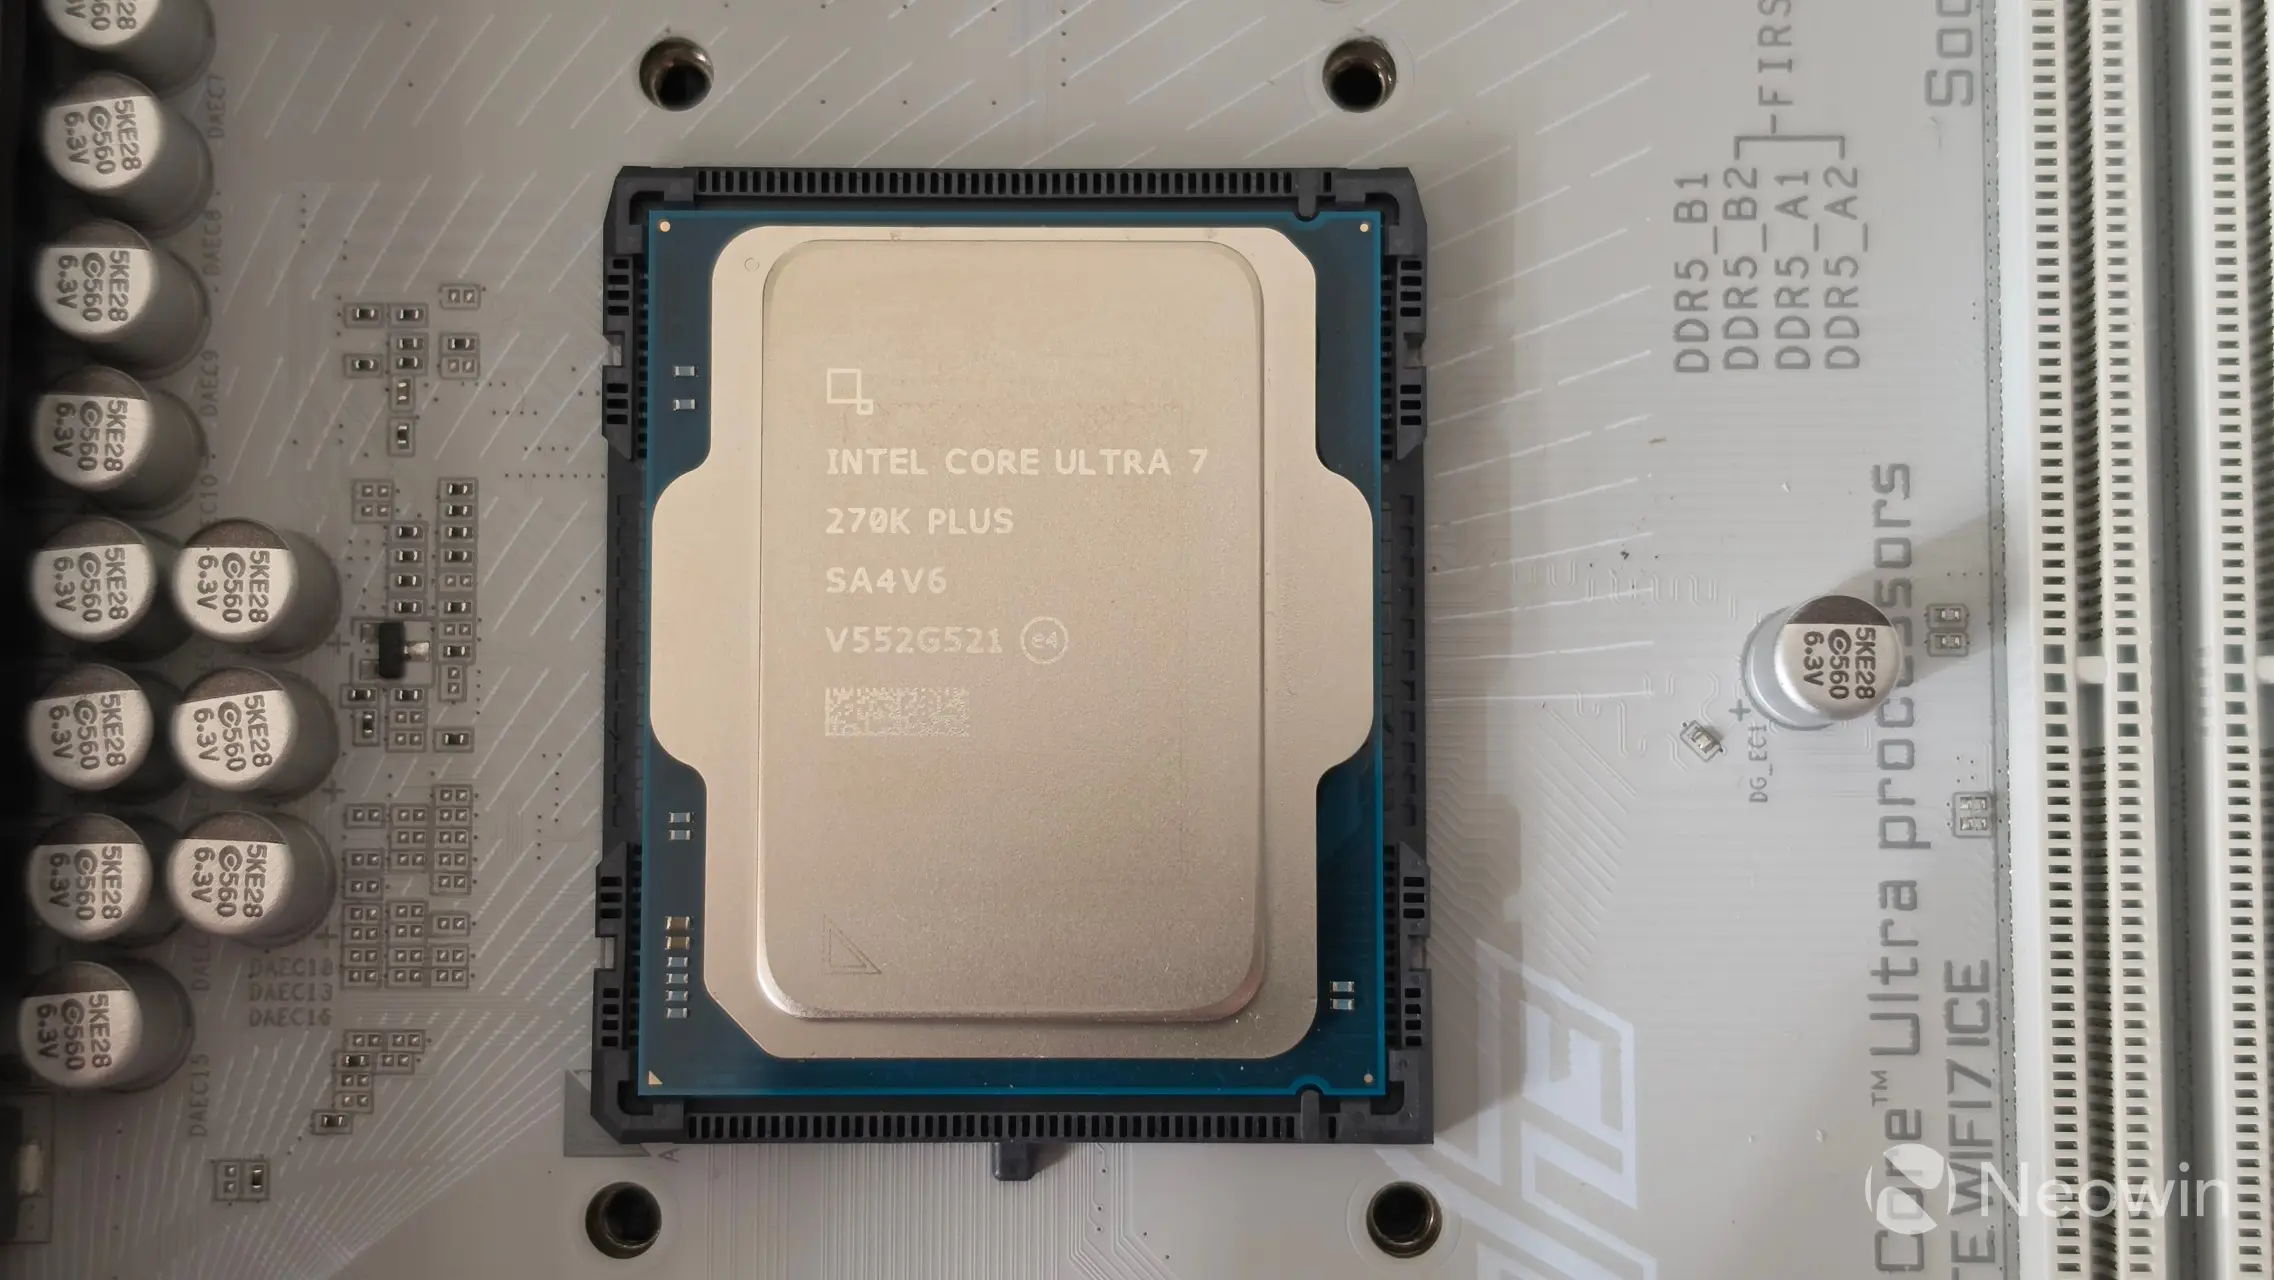
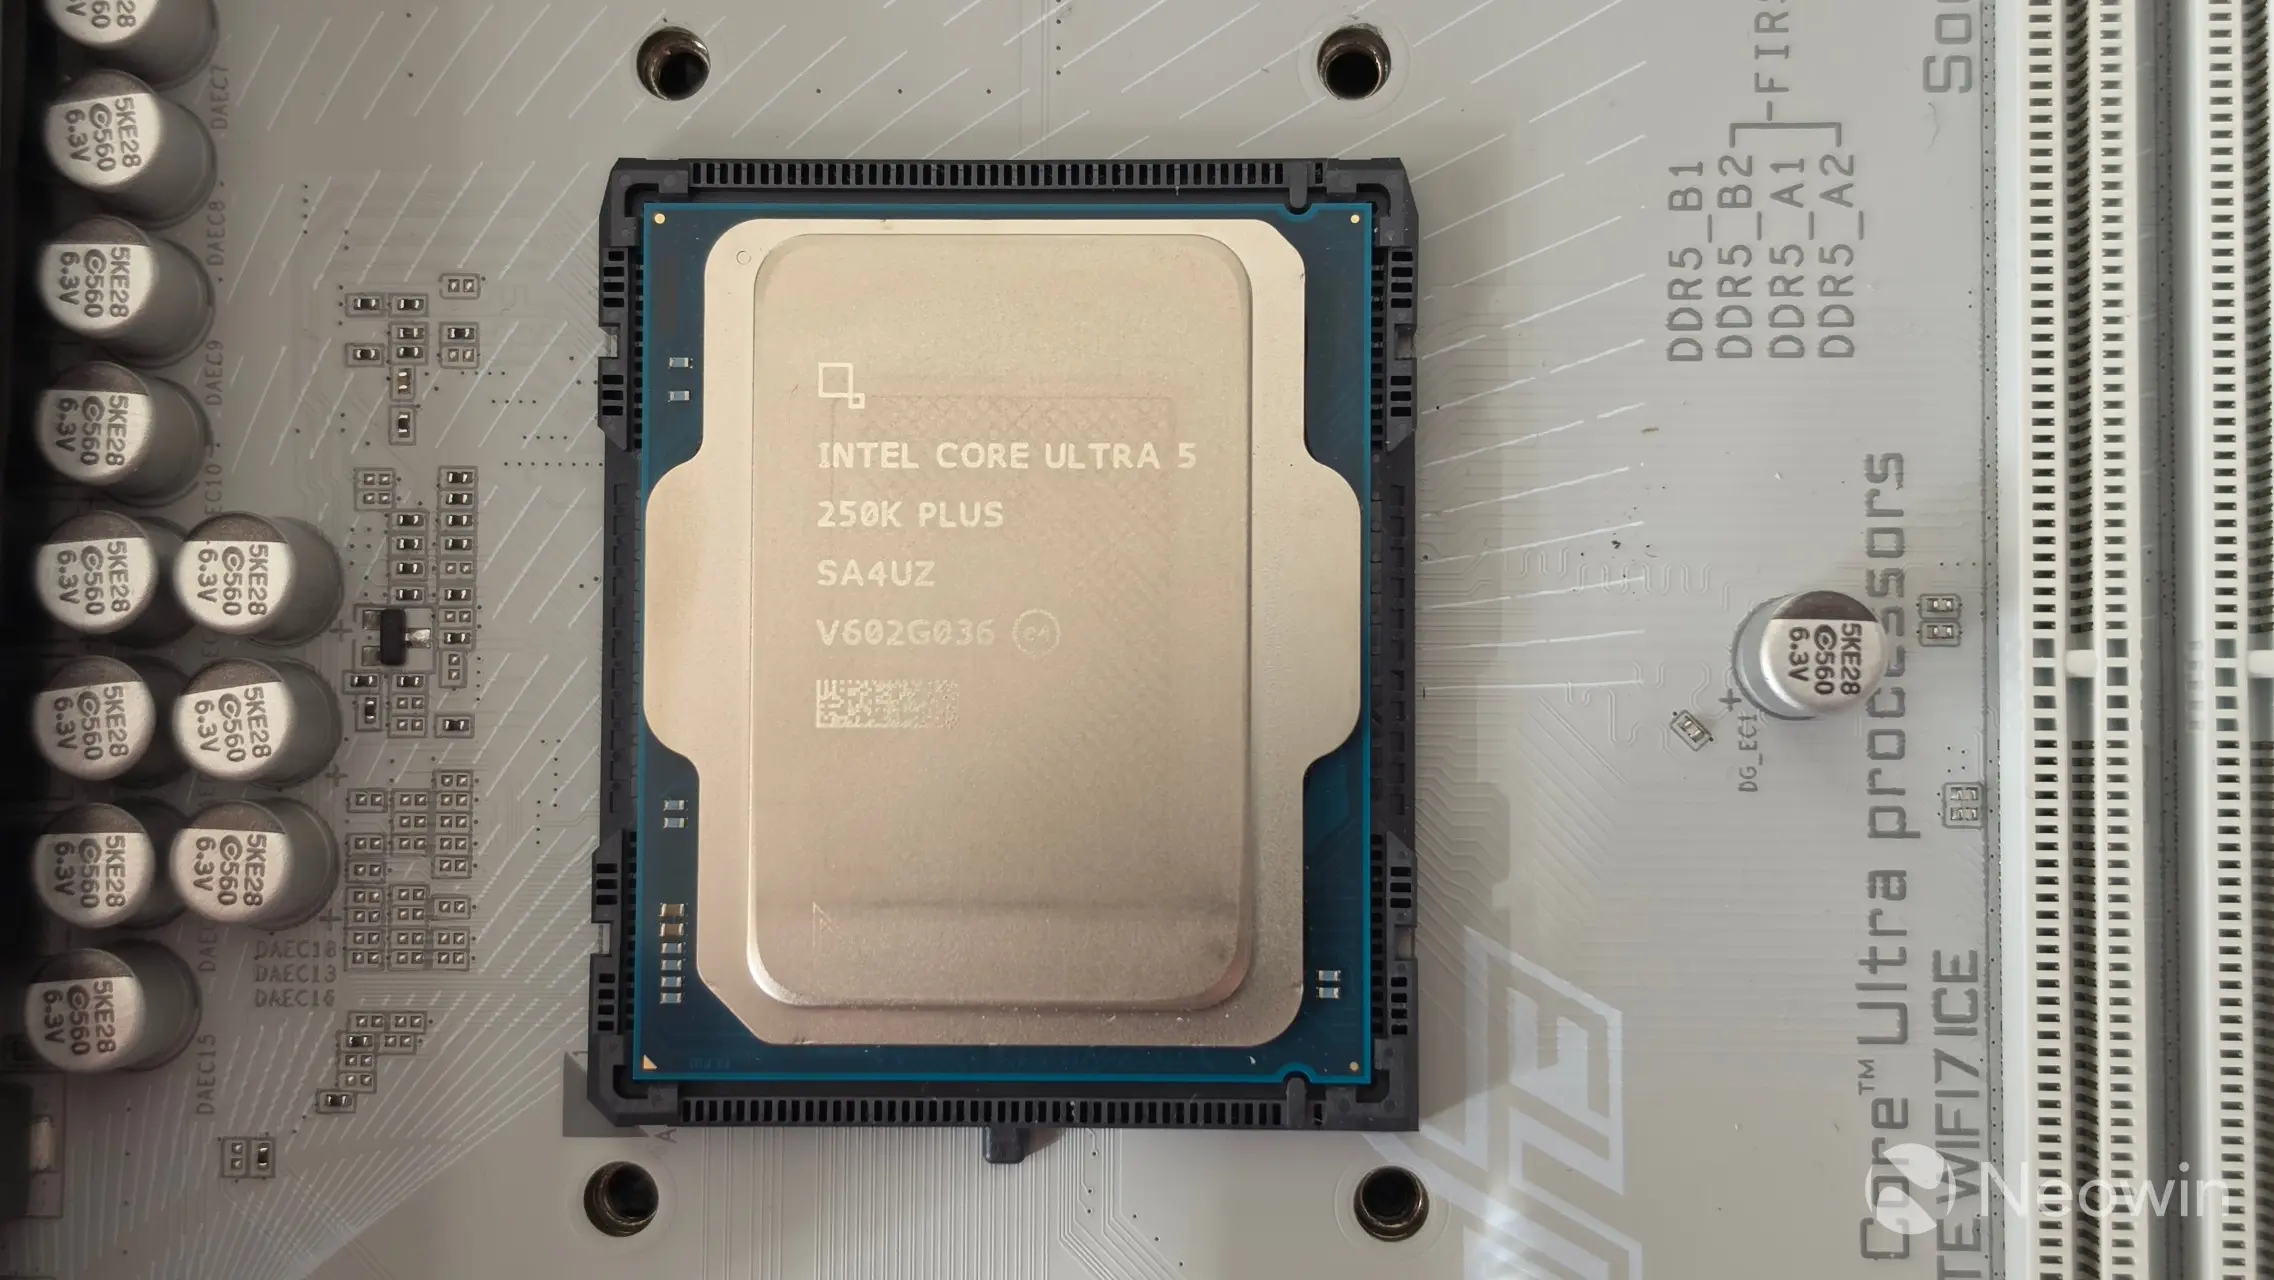
The "Plus" series is a refresh of the 15th-gen Arrow Lake series of Intel"s Core Ultra desktop processors, which were officially announced on March 11. They are based on the same LGA1851 socket design of the Core Ultra (Series 2), but on the software side, they also add a new Intel Application Optimization Tool with the Arrow Lake-S refresh. Intel says that it is the "first-of-its-kind binary translation layer optimization capability that can improve native performance in select games." which we"ll see in our benchmarks later on.
The full specs of the Intel CPUs are listed below.
| Feature | Core Ultra 5 250K Plus | Core Ultra 7 270K Plus | Core Ultra 9 285K |
|---|---|---|---|
| Socket | LGA 1851 | ||
| Processor Cores (P+E) | 18 (6+12) | 24 (8+16) | 24 (8+16) |
| Processor Threads | 18 | 24 | 24 |
| Intel Smart Cache (L3) | 30 MB | 36 MB | 36 MB |
| Total L2 Cache | 30 MB | 40 MB | 40 MB |
| Thermal Boost | na | na | 5.7 GHz |
| Max Turbo Frequency | 5.3 GHz | 5.5 GHz | 5.5 GHz |
| Turbo Boost Max Technology 3.0 | na | 5.5 GHz | 5.6 GHz |
| P-Core Max Turbo Frequency | 5.3 GHz | 5.4 GHz | 5.5 GHz |
| E-Core Max Turbo Frequency | 4.6 GHz | 4.7 GHz | 4.6 GHz |
| P-Core Base Frequency | 4.2 GHz | 3.7 GHz | 3.7 GHz |
| E-Core Base Frequency | 3.3 GHz | 3.2 GHz | 3.2 GHz |
| Intel Graphics Base Frequency | 300 MHz | ||
| Intel Graphics Max Frequency | 1.9 GHz | 2.0 GHz | |
| Xe Cores / TOPS | 4 Xe Cores / 8 TOPS | ||
| Total PCIe Lanes | 24 | ||
| Max Memory Speed | DDR5 7200 MT/s | DDR5 6400 MT/s | |
| Memory Capacity | 256 GB | 192 GB | |
| Intel AI Boost (NPU) | 13 | ||
| Processor Base Power | 125 W | ||
| Max Turbo Power | 159 W | 250 W | |
| Price (MSRP) | $199 | $299 | $589 |
Hardware
Test system
- Intel Core Ultra 5 250K Plus (Amazon|Newegg)
- Intel Core Ultra 7 270K Plus (Amazon|Newegg)
- Intel Core Ultra 9 285K (Amazon|Newegg)
- GIGABYTE Z890 AORUS ELITE WIFI7 ICE (BIOS F19) (Amazon|Newegg)
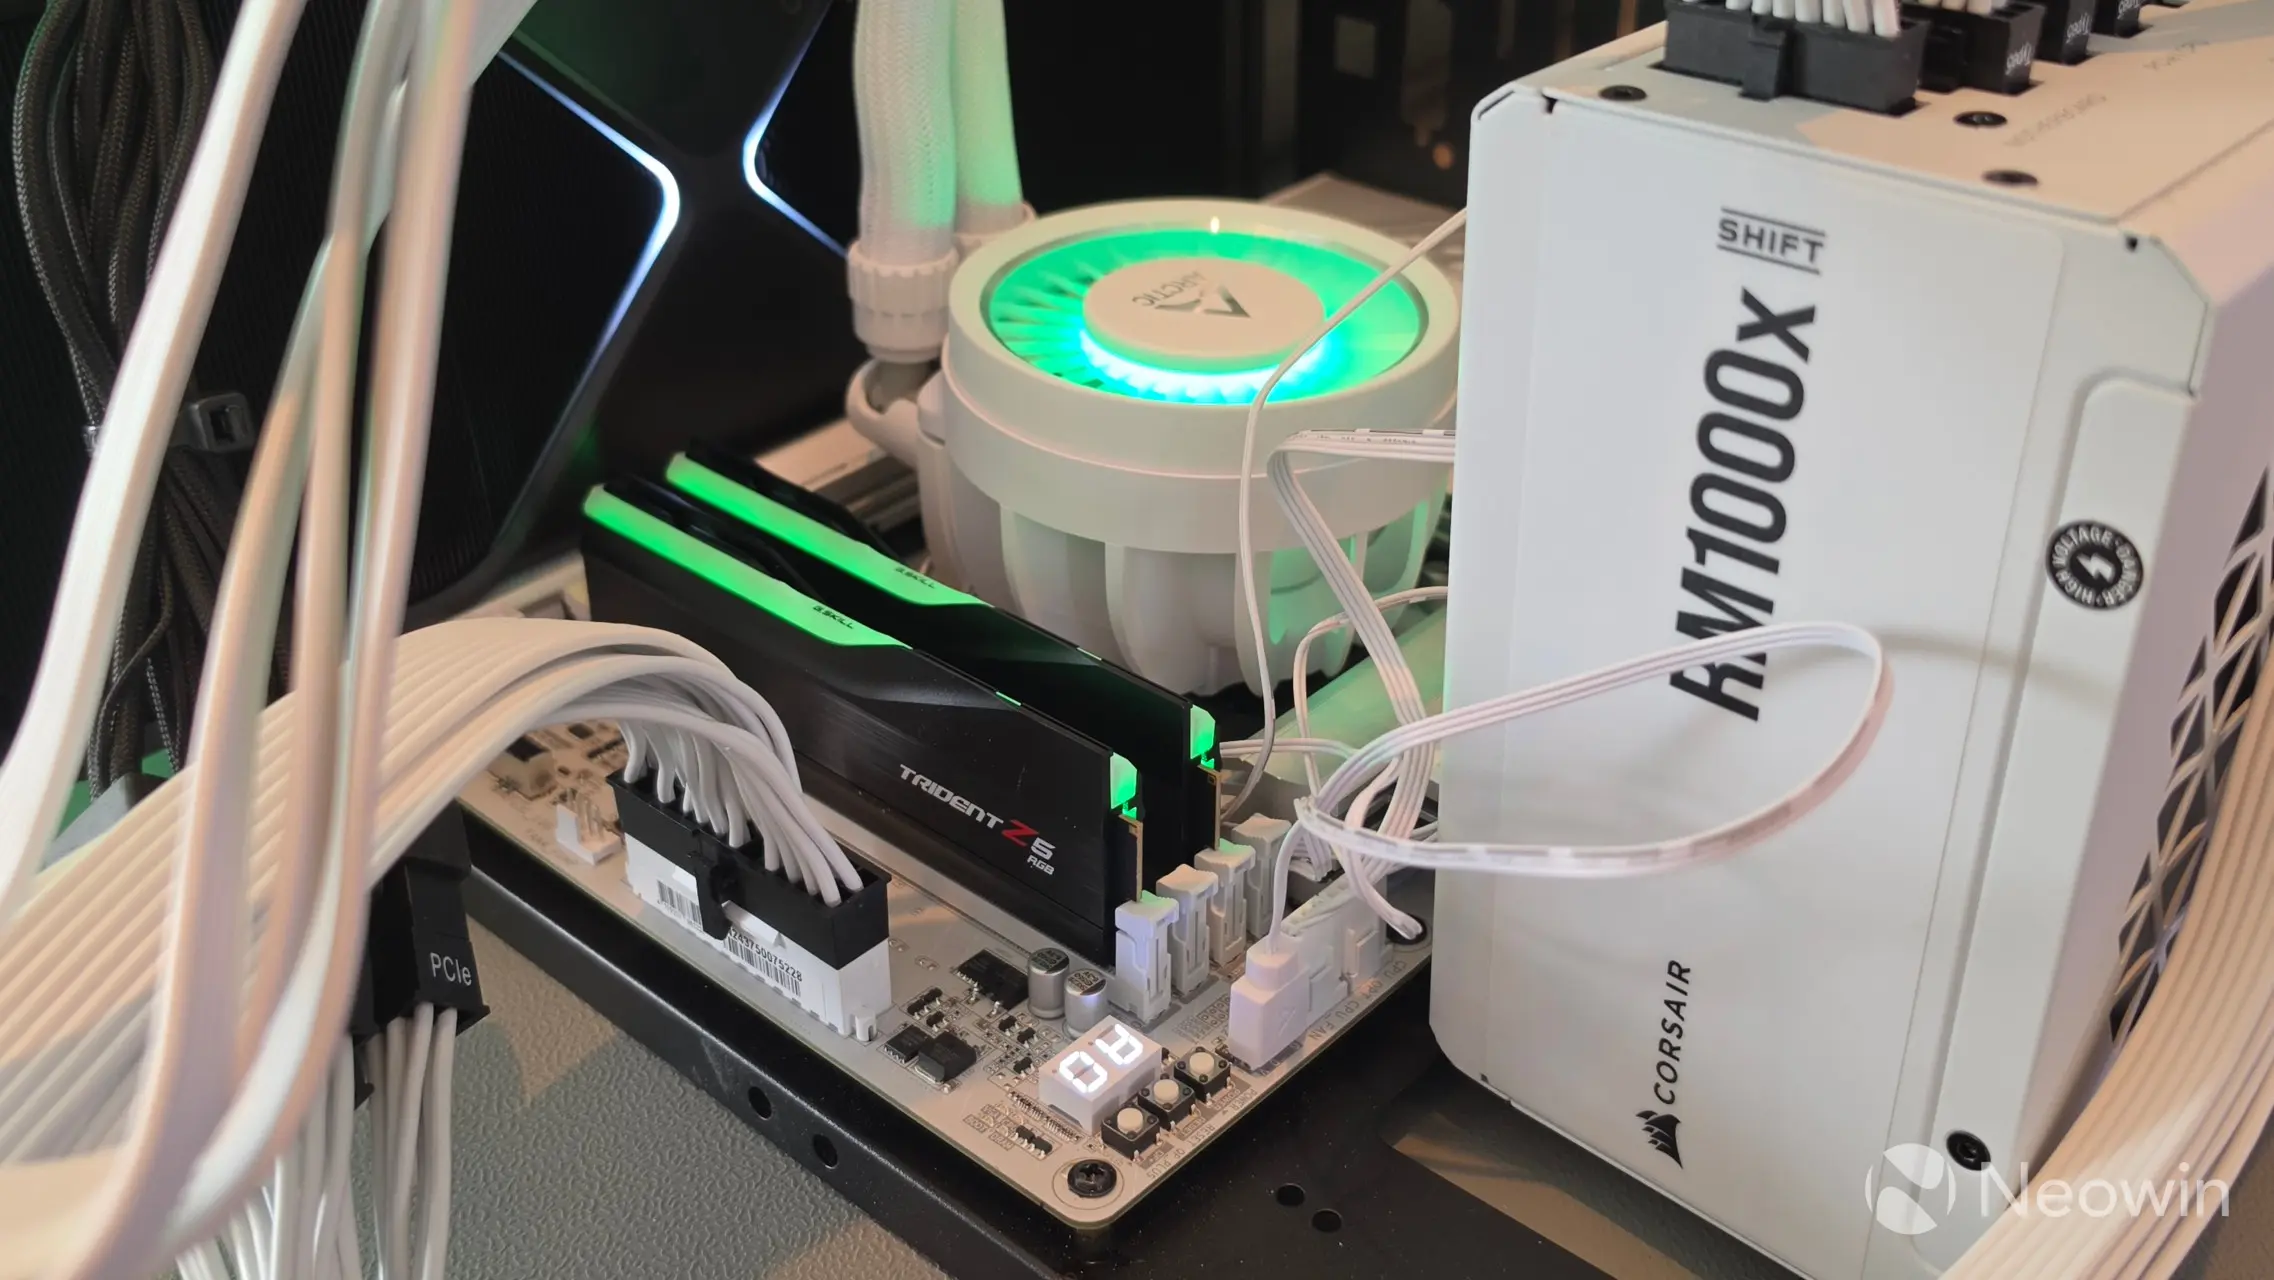
- Corsair RM1000x SHIFT (Amazon|Newegg)
- ARCTIC Liquid Freezer III Pro 360 A-RGB (White) AIO (Amazon|Newegg)
- Thermal Grizzly KryoSheet - 44x37 (Amazon|Newegg)
- 2x 16GB G.Skill Trident Z5 RGB (7200 MT/s in XMP) (Amazon|Newegg)
- TEAMGROUP MP44Q 4TB NVMe (PCIe 4.0) (Amazon|Newegg)
- NVIDIA RTX 5090 Founders Edition
- Windows 11 Professional Build 26200.7623 (Neowin Deals)
- NVIDIA driver 595.79
Reference System
- Lian Li O11 Dynamic EVO RGB
- AMD Ryzen 9 9950X3D (Amazon|Newegg)
- Gigabyte X870E AORUS MASTER (BIOS v1.28) (Amazon|Newegg)
- Corsair RM1000x (2024) (Amazon|Newegg)
- Lian Li HydroShift LCD 360R (Amazon|Newegg)
- 2x 32GB Kingston Fury Beast RGB DDR5 @ 6000MT/s in EXPO (Amazon|Newegg)
- TEAMGROUP T-Force Z540 2TB (Amazon|Newegg)
- NVIDIA RTX 5090 Founders Edition
- 2x Exhaust, 6x Reverse Lian Li Uni TL 140mm (5 are LCD) case fans (Amazon|Newegg)
- Windows 11 Professional Build 26200.7623 (Neowin Deals)
- NVIDIA driver 595.79
Only the NVIDIA GeForce RTX 5090 Founders Edition was used between both systems (I do not have two of these cards!). This was to see how the CPUs complemented the same dGPU in some of the benchmarks, and Game Mode was on in Windows 11.
We picked the Ryzen 9 9950X3D as it can represent almost the entire 9000X3D CPU stack. In gaming mode, the 9950X3D uses only one of its two 8-core CCDs, the one that has the 3D V-cache, which means it is essentially representative of the performance of Ryzen 7 9800X3D and the 9850X3D.
The Intel test hardware was open plan, and as mentioned in the hardware specs above, I ensured that I had the latest stable BIOS, firmware, and drivers from the respective hardware manufacturers. Resizable BAR was enabled (default BIOS setting) as was MultiCore Enhancement (MCE), which was on Auto by default, and which showed it as "Enabled". On a similar note, Precision Boost Overdrive (PBO) was set to "Advanced" on our AMD system, which is also the default setting.
Essentially, we ran everything on the default settings since that was the idea, as the average user won"t go into BIOS immediately to play around with the settings.
I resisted using thermal paste because of the mess, and secondly, because it"s not part of my day job to be swapping around CPUs multiple times a week. In addition, I had a good experience with Thermal Grizzly back in 2023, so I have stuck with it. For our CPU swap-outs, I used a Thermal Grizzly KryoSheet, which is reusable, so long as it doesn"t get damaged.
When handling any of the hardware, I always used an anti-static band. Our test motherboard had Power and Reset buttons right above the debug LED screen.
Benchmarks
For our benchmarks, hwinfo.com provided a commercial license of HWiNFO, and UL Solutions provided us with Professional (commercial use) licenses for 3DMark and Procyon.
Sayan Sen contributed to this review and also provided the benchmark graphics.
Before we begin, here are the CPU-Z screenshots of the 270K Plus (above) and 250K Plus (below).
Unlike our 14900K/14600K review, we did not test iGP media decoding and gaming performance this time, as it was clear from that review how much of a cakewalk it was for the Intel on-board graphics, since it had left AMD Radeon Graphics in the dust. That"s not to say that AMD RDNA 2 iGP is bad, though; it"s just not as capable, but it can still serve you fine for standard 1080p60 video playback.
We moved on to test scenarios with a dedicated discrete GPU (dGPU). The following benchmarks were done with a Founders Edition RTX 5090 in the system. We start with 3DMark graphics benchmarks, wherein we opted to use custom CPU-bound settings. These tests are heavily GPU-focused, but we tried our best to simulate a CPU-heavy situation.
Our very first test presented an oddball as the Core Ultra 5 250K Plus managed to beat out every other CPU in Fire Strike, including the 9950X3D. Fire Strike is a DirectX 11 test, which is heavily single-threaded. We ran the test multiple times to fix this overperformance bug, but to no avail.
Next, we have Time Spy, and again, the 250K Plus performed exceptionally well here too, although not to the same extent as we saw in Fire Strike. Time Spy runs on DirectX 12 feature level 11 and is more threaded than Fire Strike. The 9950X3D was, for some reason, the most disappointing one here.
Following that, we have the CPU Profile, which is also a physics processing test but measures CPU thread scaling efficiency.
The Ryzen 9950X3D wins with 16 threads, though beyond that, the Core Ultra 200S processors begin pulling ahead. However, since most games tend not to utilize anything more than 12-16 threads, in real-world gaming scenarios, the usefulness of the extra Intel threads will likely be very limited.
We move on to the second DirectX 12 3DMark synthetic benchmark called Steel Nomad Light, which is a more modern test based on feature level 12. As such, it is even more threaded, and here the 9950X3D shines. All three Intel Core Ultra processors essentially tied here.
Finally, we have Speed Way, which is built upon DX12 Ultimate (feature level 12_2) and packs DirectX Raytracing (DXR) to measure ray tracing performance of discrete cards. Even at 720p, the benchmark proved to be GPU-bound as we saw no significant difference between the tested CPUs. The Ryzen 9 9950X3D was ever-so-slightly ahead of the others.
Next, we move on to real games.
As was the case with our 3DMark synthetic benchmarks, we are immediately greeted with an oddball here, too, as the 250K Plus, in this case, for some reason, underperforms in 2018"s Assassin"s Creed Odyssey. The 270K Plus impresses, though, as it overtakes the much more expensive 285K. The title is based on the AnvilNext 2.0 engine.
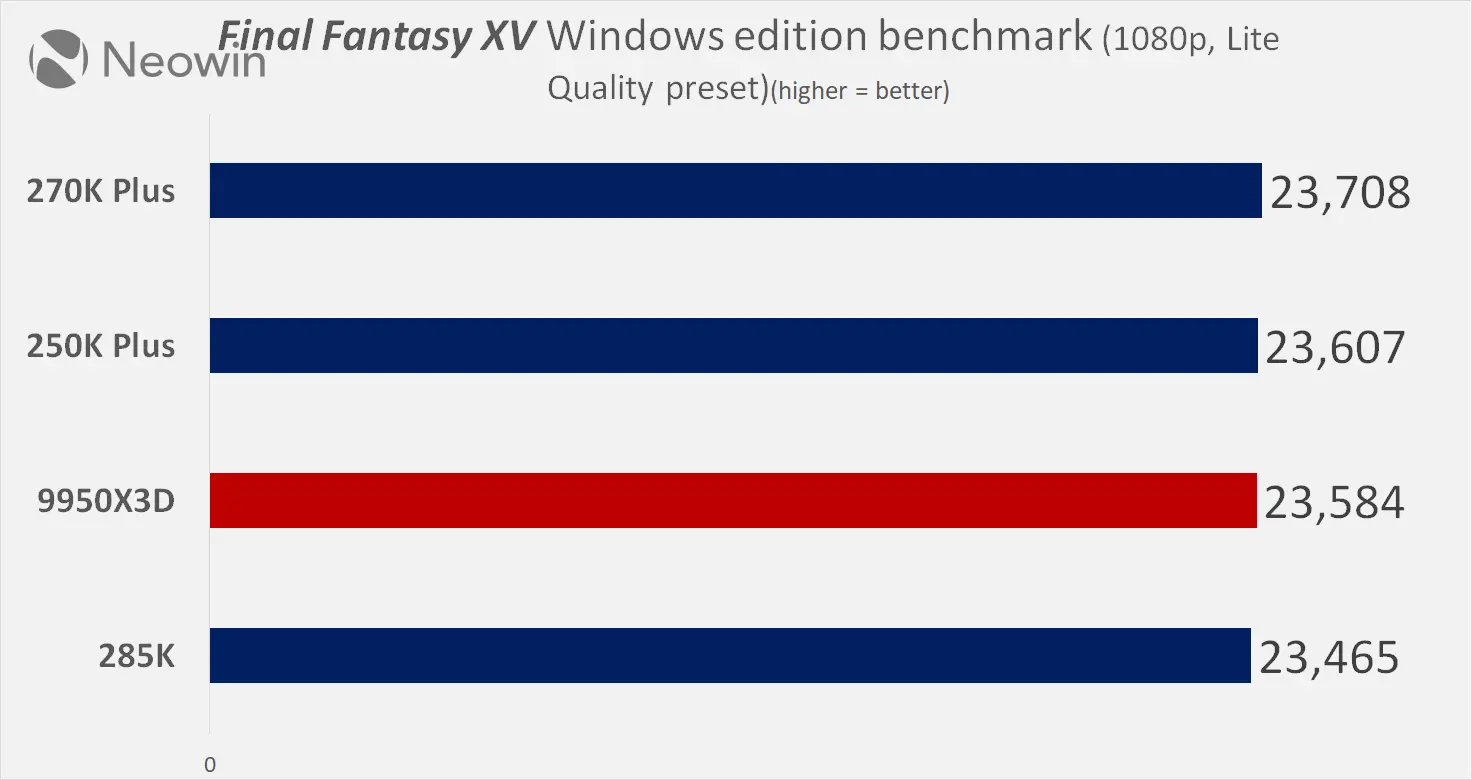
We tested another DirectX 11 title with Final Fantasy XV, based on Luminous Engine. The game came out in 2016 and, as such, did not present any differences between the CPUs even at the 1080p Lite Quality preset.
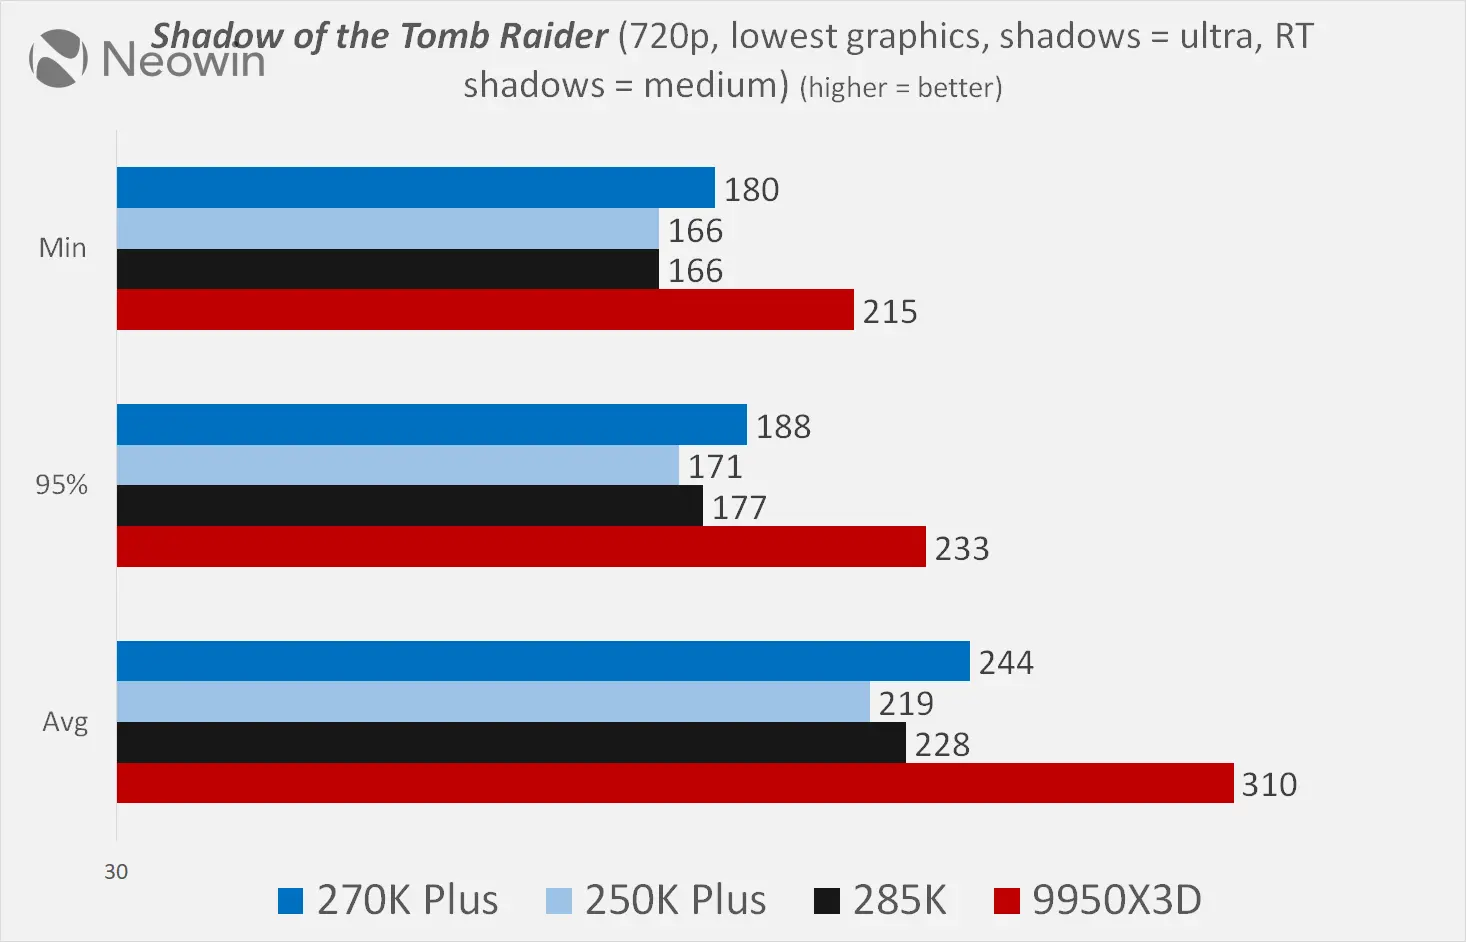
Up next, we have our first DirectX 12 game in the form of Shadow of the Tomb Raider, based on the Foundation engine. On our custom CPU-bound settings, the Ryzen 9 9950X3D blew past all the Intel CPUs. However, what is almost equally impressive is that the much less expensive 250K Plus and 270K Plus are able to match and even surpass the last generation"s 285K.
Next, we have 2020"s Cyberpunk 2077 running on the RED engine. Like with Tomb Raider, the 250K Plus and 270K Plus are either very close to or beating the more expensive 285K. The 9950X3D, of course, is again in a tier above.
2021"s Hitman 3 is next, based on the Glacier Engine, and the AMD 9950X3D CPU is in an entirely different league here. The Intel CPUs are essentially tied, with all of them around the 150-160 FPS range. Regardless, this is still praiseworthy for sure, as both the new Plus SKUs beat the 285K, albeit by a very narrow margin.
We have another 2021 DX12 title in Far Cry 6, based on the Dunia engine. The title is known to be single-thread heavy and hence is a good metric to measure such game scenarios. The mighty AMD X3D processor again shows its prowess here, though the Intel 270K Plus and 250K Plus are no slouches, especially given their price points.
F1 24 is based on Codemasters" in-house EGO engine, and the game shows just how brilliant Intel"s new 200 Plus series is, as both chips outperform the much more costly 285K. Of course, again, AMD"s 9950X3D is in a league of its own in this racing title.
Our final game test is Capcom"s Monster Hunter Wilds, which runs on the publisher"s own RE engine. All chips were essentially tied here, although for bragging rights, the new Core Ultra 7 270K Plus can claim it beat the 9950X3D.
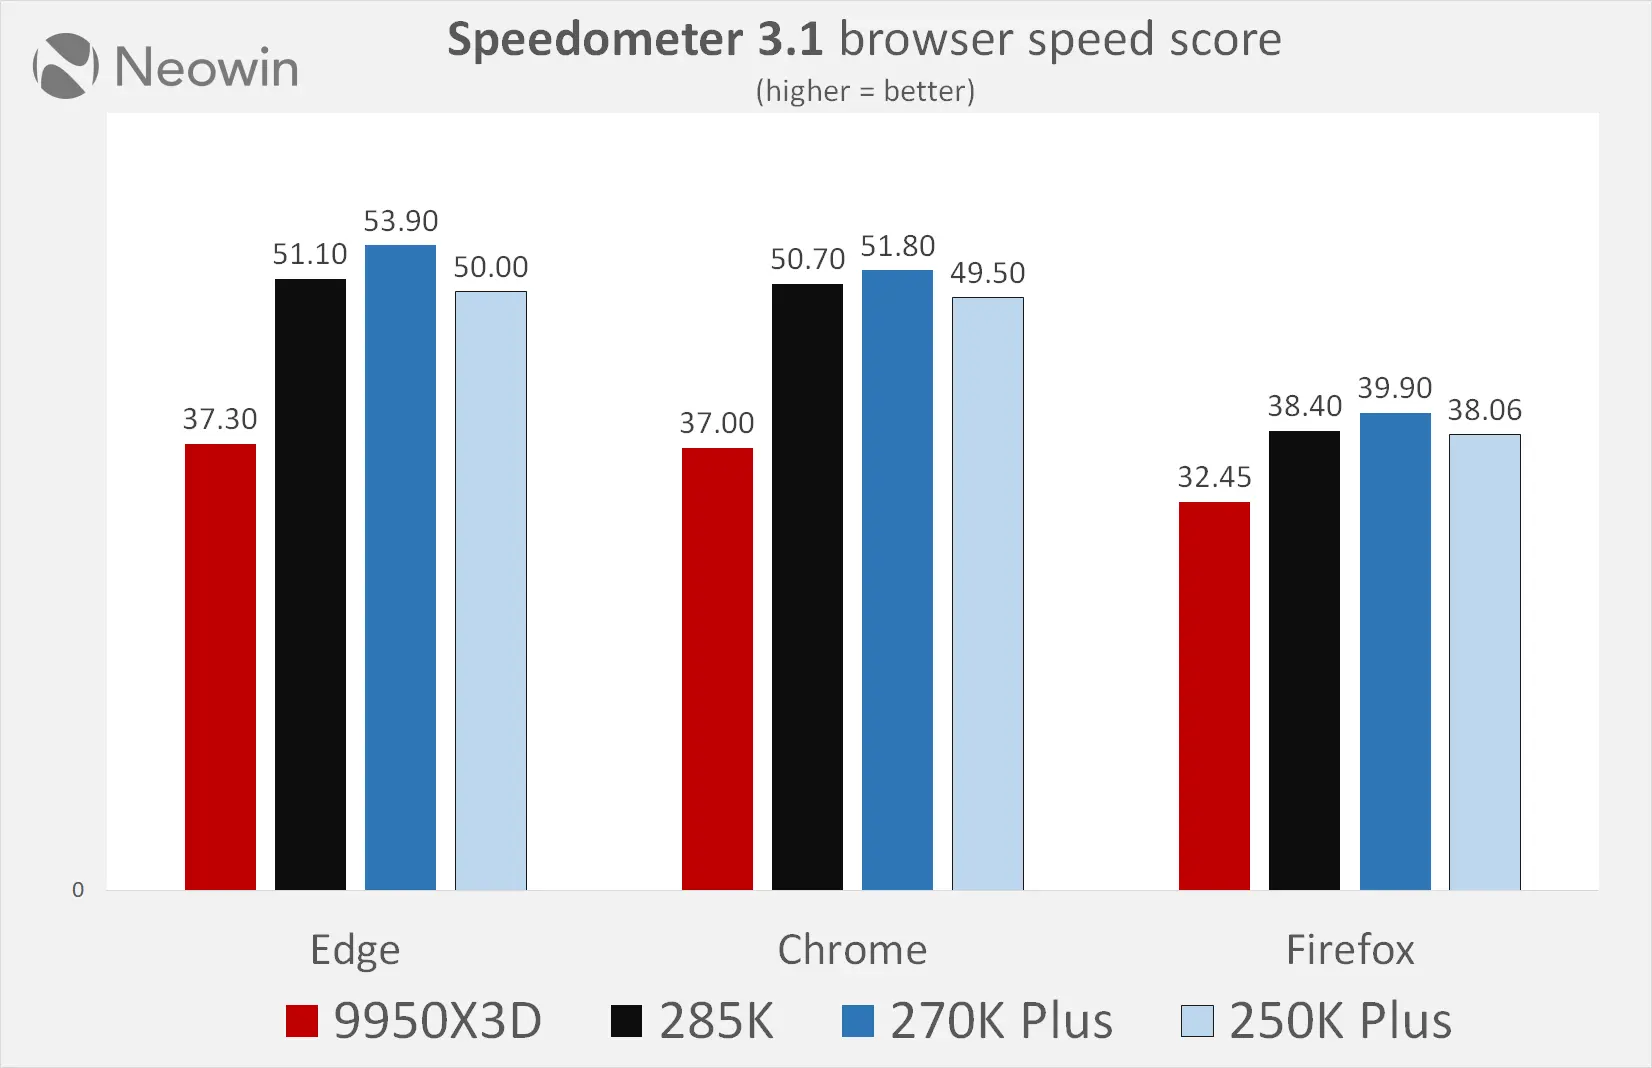
With gaming done, we now move to productivity testing. We start off with web browsing performance that we measured using Speedometer 3.1. Surprisingly perhaps, the AMD X3D processor was quite weak here on all three tested Windows 11 browsers, especially on Chromium-based Edge and Chrome.
Cinebench 2024 and 2026 are up next. These are Cinema 4D-based rendering tests and use all available threads of the processor.
What"s interesting here is that, despite the 9950X3D having the higher number of threads, 32 in total, Intel"s non-hyper-threaded 24-core CPUs, the 285K and the new 270K Plus, outdo the AMD processor on both versions of the Cinema 4D benchmark.
Next up, we have Office performance, and here too, we see the Intel processors outperform the AMD Ryzen 9950X3D. Sure, the AMD chip is touted as a gaming CPU, but Team Blue most certainly deserves praise here as it is able to outmuscle the much more expensive Team Red part.
The default precision value is set to FP32 (float32), and we proceeded with that in our Procyon AI Computer Vision benchmark from UL, which was up next. This was done to test the AI inferencing throughput of the CPUs.
We got a bit of an oddball score again with this one, as Intel 270K Plus and 250K Plus were quite a bit off here; truth be told, we were expecting closer to 285K performance with WindowsML and CPU inferencing mode. However, using OpenVINO for the NPU test, the gap with the 285K narrowed.
Next, we have our biggest victory for the AMD Ryzen 9 9950X3D. This is in AIDA64"s AES test, which measures the encryption capabilities of the processor. Here, the 9950X3D was almost three times faster than the 270K Plus, more than justifying the $699 price tag.
In our next test, PhotoWorxx, it flips, as the 250K Plus actually sits on top. As the name suggests, this test measures aspects of digital photo processing and editing. It not only tests the integer unit on the processor but also the memory subsystem. This may explain why the Intel SKUs are so much faster, as they are able to support much faster memory.
It"s a return to script again on the ZLib compression test as 9950X3D is victorious. Like PhotoWorxx, ZLib also stresses both the CPU"s integer unit and the memory.
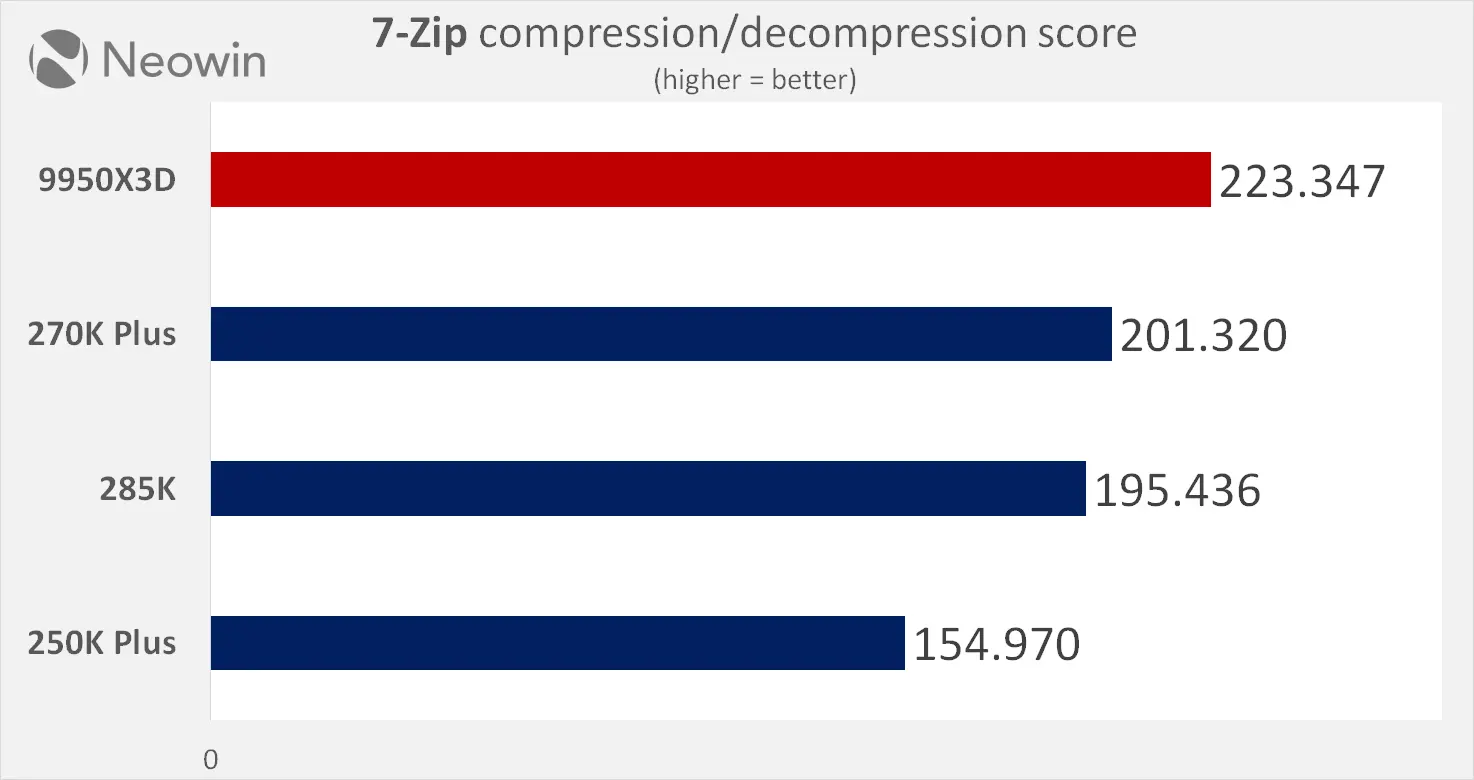
Finally, we have 7-Zip compression and decompression test, which rates in GIPS (billion instructions per second). AMD Ryzen 9950X3D expectedly wins this 32MB dictionary exercise, but the 270K Plus was really close to it in second place. It was also significantly faster than its 250K Plus sibling.
Power Consumption
In the chart below, we have put the processor power consumption figures for the most intense workloads in our test suite. Cinebench 2024 and 2026 are the most stressful as they saturate the entire available CPU cores and threads, thus giving us an idea of how much maximum juice these things can pull.
Both the 285K and the 270K Plus max out around ~248 watts in the rendering tests. In the games, the usage is certainly lower as they hover around 130-170 watts max wattage. The 250K Plus is very efficient thanks to its lower TDP.
To make better sense of the data above, we also include the performance figures and have calculated a power efficiency metric. AMD"s Ryzen 9950X3D rules the roost, but the new Intel 250K Plus is close behind for sure. A disappointing aspect here is that Intel does not seem to have made any significant efficiency gains with the Arrow Lake Refresh, as the 285K and 270K Plus, both 24-threaded, are essentially trading blows.
A note on the clock speeds here: We saw the Intel Core Ultra 7 270K Plus maintain an average clock speed of 4913.8 MHz in Cyberpunk 2077 and 4642.2 MHz in Shadow of the Tomb Raider. The processor boosted all the way up to 5400 MHz or 5.4 GHz, which is its P-core Max Turbo frequency.
Meanwhile, its smaller sibling, the 250K Plus in Cyberpunk 2077, managed an average P-core boost of 4749.4 MHz, and in Shadow of the Tomb Raider, it was at 4432.7 MHz. The P-core Max Turbo frequency was 5.3 GHz.
Both processor SKUs had a D2D (die-to-die) and NGU (next gen uncore) fabric clock frequencies of 3000MHz and 3200 MHz, respectively.
Conclusion
There are a whole lot of good things to say about the new Intel Core Ultra 200S Plus series, as it is probably evident from the benchmarks above. The new chips may not be the best out there, but Intel, it seems, has realized that you don"t need to be the best outright product to sell; there"s also the option to offer so much in terms of value.
The new Core Ultra 7 270K Plus and Core Ultra 5 250K Plus do just that. They offer compelling choices at the $199 and $299 price points, respectively, so much so that AMD may no longer be the default go-to for people wanting to spend that amount of money on a desktop CPU.
Not only AMD, but the new chips from Intel are so good that there"s no point in buying last-gen Core Ultra 9 285K, Ultra 7 265K, or Ultra 5 245K, unless they see a significant price reduction. Outside of some areas like encryption performance, the new Intel Core Ultra 200S Plus series is quite a bit of a game-changer.
The only notable negative of this launch is the lack of upgradeability options, as the accompanying LGA1851 socket will have no further options to get a better, more capable CPU on the same mainboard, since Intel is expected to move on to socket LGA1954 soon. This is still a big plus point in favor of the AMD Ryzen AM5 platform.
As an Amazon Associate, when you purchase through links on our site, we earn from qualifying purchases.
When you purchase through links on our site, we may earn an affiliate commission.