Nearing the end of last month, Microsoft brought new capabilities for the Power BI Snowflake connector to general availability. Today, the feature summary for the Power BI Desktop July update has been released. Unlike April's release, this update comes closer to the usual time in any given month around which these feature summary posts are published.
The focus this time around is on the release of new reporting-related features such as the capability to customize slicer header text, support for gradient legend, and more. Other components including analytics, visualizations, modeling, and data preparation have been updated with enhancements as well.
A concise summary of all that is new can be viewed through the changelog below:
- Reporting
- Gradient legend
- Ability to further customize slicer header text
- Relative time filter is now generally available
- Analytics
- Enhancements to Q&A
- Field synonyms
- Visual renames as suggested synonyms
- Orange underlines for ambiguous terms
- Updates to Q&A pop-out
- Visualizations
- Azure Maps visual (preview)
- Bubble layer
- 3D bar chart layer
- Reference layer
- Custom tile layer
- Real-time traffic overlay
- Updates to Multi-Axis Chart by xViz
- Modeling
- Support for Excel financial functions
- Model view enabled for live connect is now generally available
- Data Preparation
- Global option to disable automatic type detection
- Template Apps
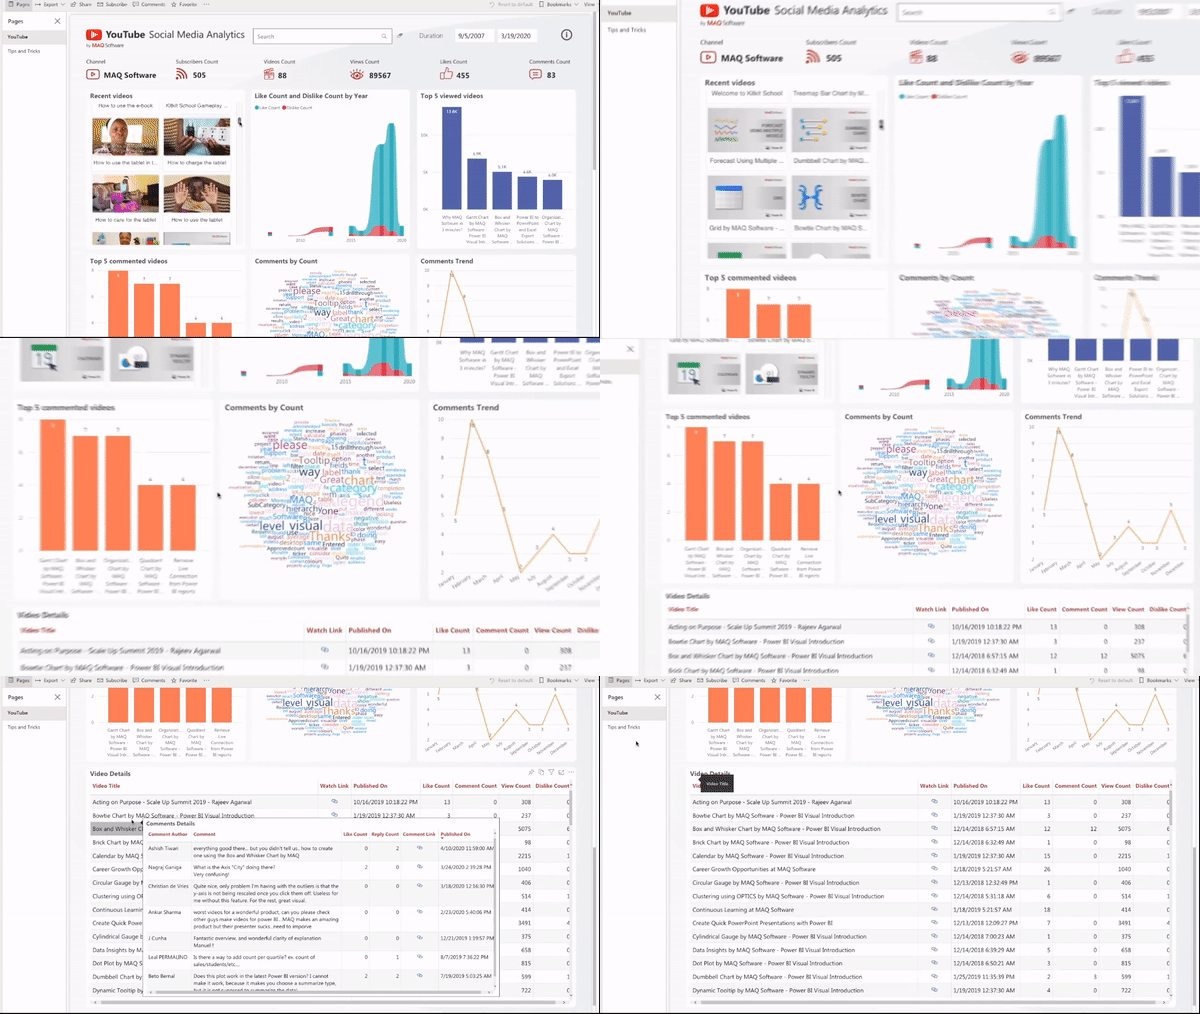
- YouTube Analytics by MAQ Software
- Other
- Launch external tools from Power BI Desktop (preview)
A more detailed explanation of some of the highlighted features has been showcased in the video below:
Last year, Microsoft also began the process of recommending a template app with each monthly Power BI Desktop update. This time around, YouTube Analytics has been put under the spotlight. Created by MAQ Software, the template app aims to provide both enterprise and independent channel owners with insights on channel performance in the form of an overview. These insights include information regarding video reach and engagement, overall success rate in terms of likes/dislikes, and more. You can download YouTube Analytics from AppSource.
This wraps up July's feature summary for Power BI Desktop. The latest version of the application can be checked out here.


